If this is your first visit, be sure to
check out the FAQ by clicking the
link above. You may have to register
before you can post: click the register link above to proceed. To start viewing messages,
select the forum that you want to visit from the selection below.
Spike,
Could you look at SWIR's chart? Does it look like a double bottom to you? I'm still trying to learn the charts.
Thanks
Yaoyao
Sure. Yep, it's a double bottom.
Originally posted by yaoyao
Spike,
Just want to say that I really really appreciate your time and effort to answer each of my questions. I feel so lucky to find this site and this thread. It makes my learning much faster and more efficient. Thanks.
Ying
You're welcome. Glad you're getting something out of the thread.
Hey Spike...Let me say that I really appreciate your charts and analyses too!!!
Any thoughts on RELV??? http://trimurl.com/2M
Thanks IIC, appreciate the feedback.
Here's what I'm seeing with RELV. Omitted to put FIB on there, but there's a nice bounce off the 50% retrace of the move from 5.05 to 11.89. A reasonable projection target is 16.00, which fits well with the size of the channel.
How would you know that a double bottom would not turn into a trible bottom? In other words, how to determine entry point when you see a double bottom formation? It looks like that MAGS is heading the 3rd bottom. Will SWIR do the same?
How would you know that a double bottom would not turn into a trible bottom? In other words, how to determine entry point when you see a double bottom formation? It looks like that MAGS is heading the 3rd bottom. Will SWIR do the same?
Thanks.
Yaoyao
You wouldn't KNOW. That's why it's called speculation. You can only prepare for the two possible outcomes and act accordingly. There are no guarantees in the stock market. There are plenty of potential double bottoms that turn out triple bottoms/complete failure at support, simply because support disappeared. They only become double bottoms when there are buyers to make it so. You can never know for sure whether there WILL be buyers. But a good point of entry for anticipating a possible DB is at a good support level, whether that be a channel line, reg channel, FIB, vol by price, 20 day hourly Bband, intraday S1 or S2 etc. Then all you can do is wait and see if support comes. If it doesn't, the DB will fail, and you will exit the trade and move on.
MAGS: maybe. SWIR: perhaps. The answers are always going to be the same. Chart reading will never give you the certainty many people want. Chart reading will only give you an 'edge', nothing more. Use the edge to plan your reaction to what the market does. That's the only thing you can control: yourself.
Thanks for the update on the Qs. Sub- 30 is going to hurt unless you are on the right side. I am starting to get more comfortable on the short side, so we are probably near the bottom.
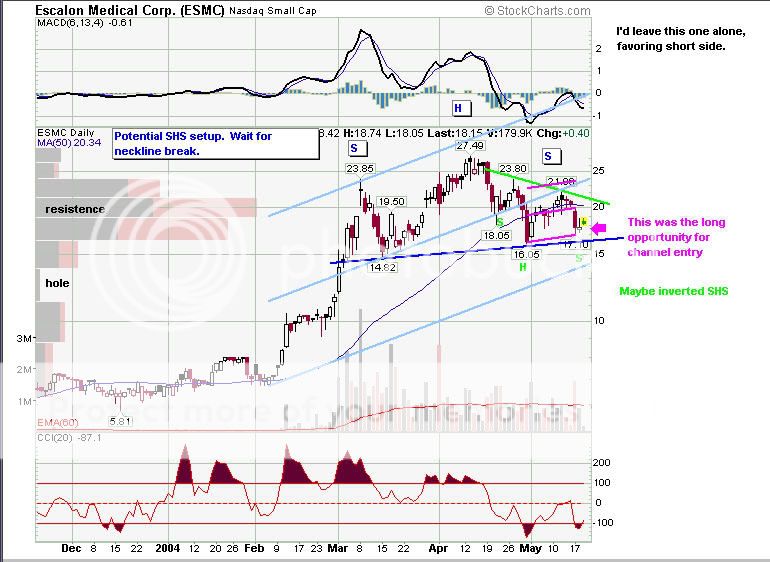
Check out ESMC when you get a chance for a short, got in today after being long. Went long for about .75 sold today and went short at 19.10. The chart looked like it could have went either way, I thought it would go higher, I was wrong and the then the chart started to deteriorate and I went short. Any thoughts would be nice.
Check out ESMC when you get a chance for a short, got in today after being long. Went long for about .75 sold today and went short at 19.10. The chart looked like it could have went either way, I thought it would go higher, I was wrong and the then the chart started to deteriorate and I went short. Any thoughts would be nice.
Thanks,
Orion
I know you are looking for Spike's response...But let me throw something in here...At the close Friday, ESMC had a Bullish MACD crossover...Of course that went down the drain today on news http://trimurl.com/3C
How about MATK?...news killed that one today too.(Fire)
"Trade What Is Happening...Not What You Think Is Gonna Happen"
It never crossed over on the chart I was looking at, and it is about to crossover to the downside of the zweo line. It also has a CCI sell signal on my chart. What parameters do you use for your MACD? Not to mention it was IBDs #1 for weeks on end. MATK looks good as well, its a little to expensive for me on a per share basis right now. Thanks for the heads up.
It never crossed over on the chart I was looking at, and it is about to crossover to the downside of the zweo line. It also has a CCI sell signal on my chart. What parameters do you use for your MACD? Not to mention it was IBDs #1 for weeks on end. MATK looks good as well, its a little to expensive for me on a per share basis right now. Thanks for the heads up.
Orion
I saw the crossover on Stockcharts over the weekend...it was even on their scan list.
"Trade What Is Happening...Not What You Think Is Gonna Happen"
Thanks for the update on the Qs. Sub- 30 is going to hurt unless you are on the right side. I am starting to get more comfortable on the short side, so we are probably near the bottom.
Check out ESMC when you get a chance for a short, got in today after being long. Went long for about .75 sold today and went short at 19.10. The chart looked like it could have went either way, I thought it would go higher, I was wrong and the then the chart started to deteriorate and I went short. Any thoughts would be nice.

 Tweet
Tweet


Comment